In-Class Activity 11: Styling with Django and Bootstrap:
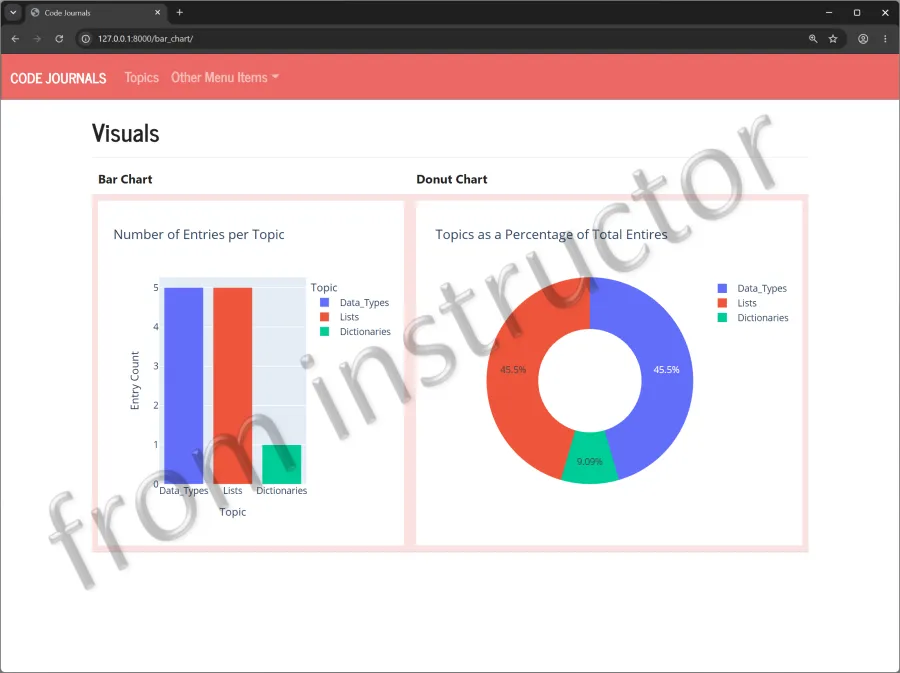
Objective: Continue styling the Django web application. Use Plotly to create a donut chart that displays each topic as a percentage of total entries.
Description: Continue using Bootstrap and the Bootswatch themes to style the new_topic.html, topics.html and topic.html pages. Add the donut chart to the bar_chart.html page and place both charts in a table row.
- Make a copy of your Activity10 folder and name the folder Activity11-StyleWithDjango. After the activity is completed, take four screenshots matching the solution images below and submit it to the first quiz question on Canvas.
- Navigate to the directory that contains manage.py and open the folder in VS code.
Part 1:
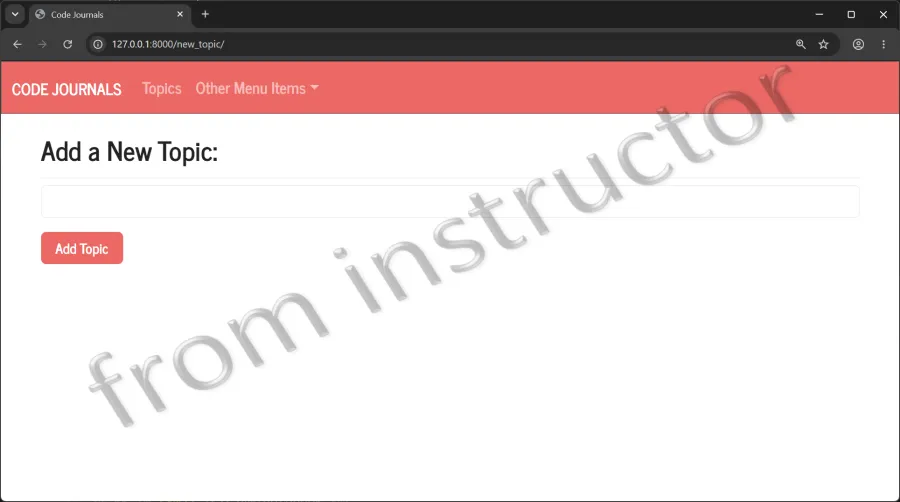
- Modify the new_topic.html file by loading bootstrap5 and use the {% bootstrap_form %} template tag instead of the {{ form.as_p }}.
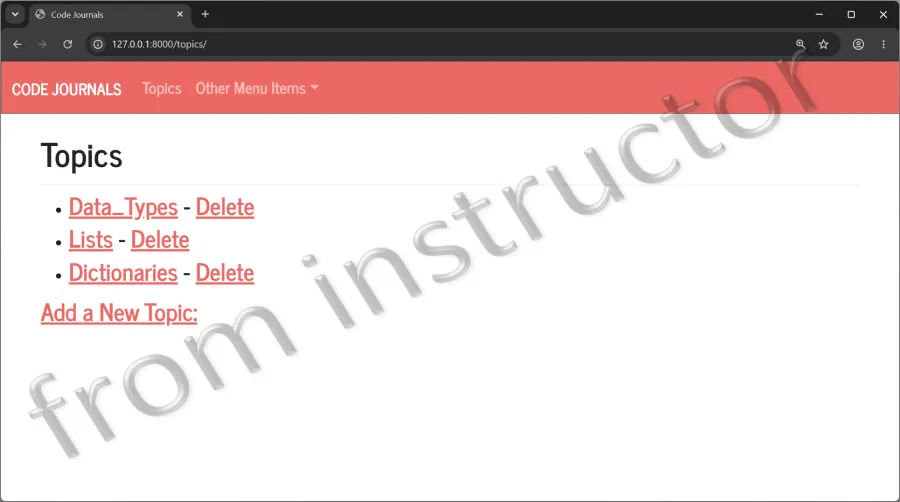
- Modify the topics.html file by adding the heading Topics inside the page_header block. Simply style each topic as an < h3> element and do the same for the link to add a new topic.
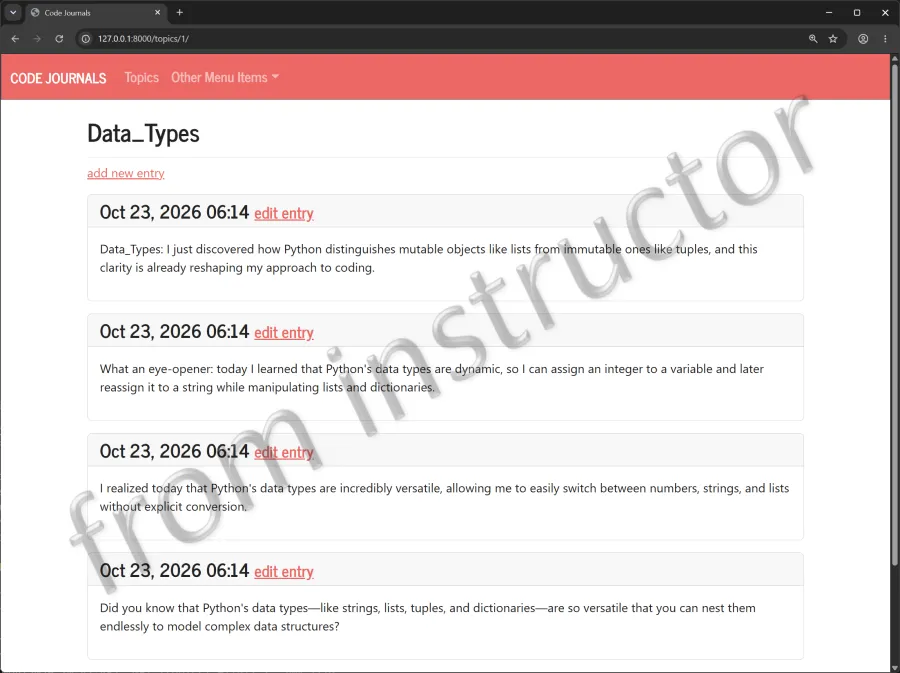
- Modify the topic.html page by using Bootstrap cards to make each entry stand out.
Part 2:
- Modify the
bar_chart()function in the views.py file and create a pie chart using Plotly express that displays each topic as a percentage of total entries. Use the dataframe, names, values, and title properties. Set the hole value to occupy 50% of the area. Name the donut chart, Topics as a Percentage of Total Entries. - Modify the bar_chart.html file. Place the bar and donut Plotly charts inside a Bootswatch-themed table row.
- Note: Source code examples of Bootstrap tables can be referenced on the Bootswatch site: https://bootswatch.com
new_topic.html
topics.html
topic.html
bar_chart.html