In-Class Activity 8: Adding New Entries and Displaying Data with Plotly Express:
Objective: Create a second form and add pages that allow users to enter their own data. Use Plotly Express and Pandas to create a bar chart that displays the number of entries per topic.
Description: Build a second Django form that handles GET and POST requests that allow users to add new entries which will save to the database. Also, display the number of entries per topic using Pandas & Plotly Express.
- Make a copy of your Activity7 folder and name the folder Activity8-AddingNewEntries. After the activity is completed, take three screenshots matching the solution images below and submit it to the first quiz question on Canvas.
- Navigate to the directory that contains manage.py and open the folder in VS code.
Part 1: Adding New Entries
- Create your second form in the file forms.py. Save this new file in the same directory as models.py.
- Append the urls.py file (code_journals/urls.py) to add an additional URL pattern for the new_entry page. This pattern should send requests to the view function
new_entry(). - Add a new view function,
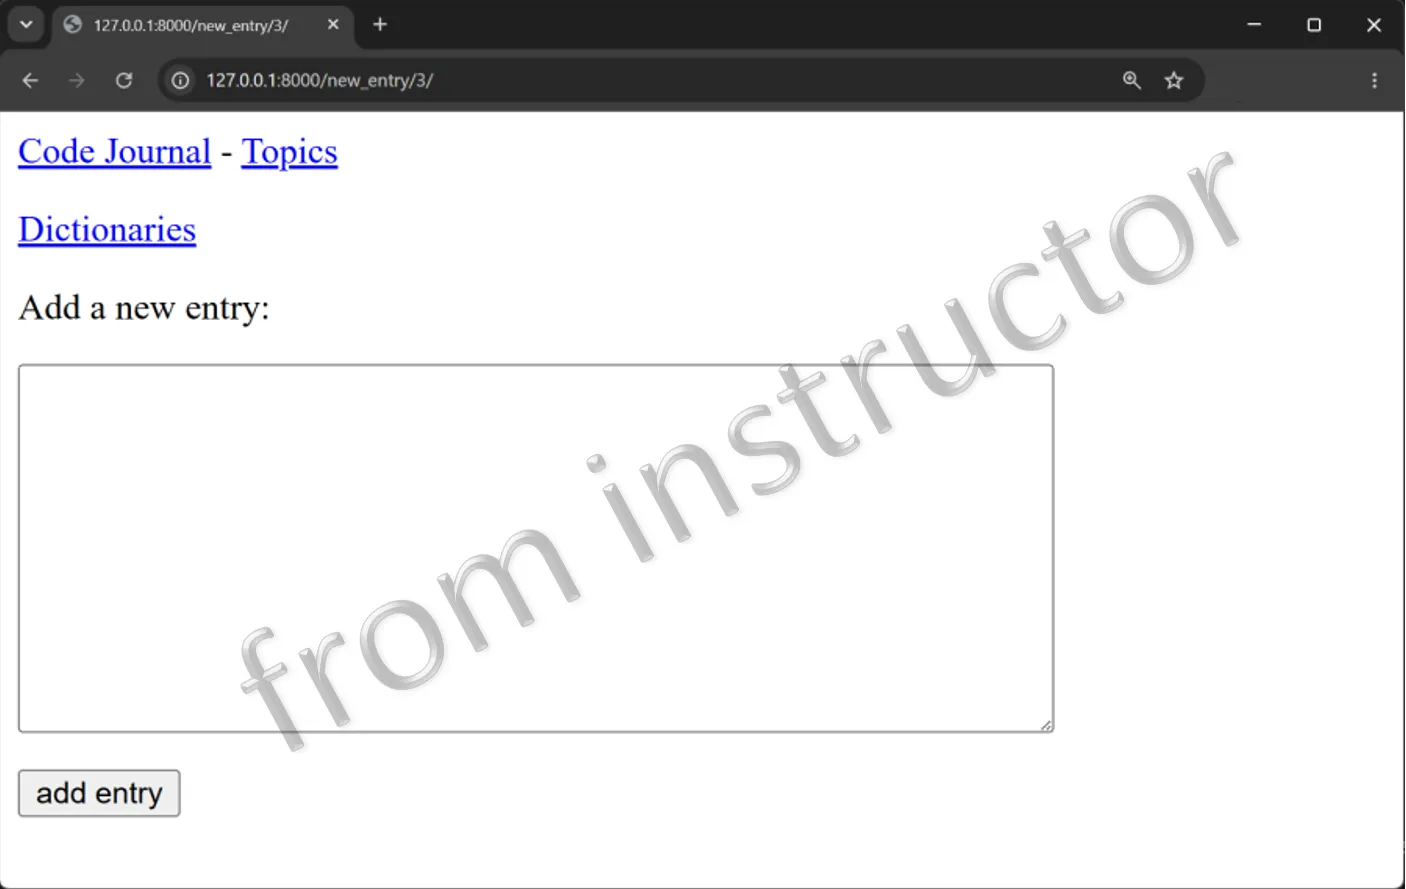
new_entry(), to handle GET and POST requests for the entry form in the views.py file. In the file, make sure to importEntryForm. - Create a new template called new_entry.html to display the form. Ensure that the template extends base.html.
- Next, edit the topic template (topic.html) to link the new_entry page from each topic page.
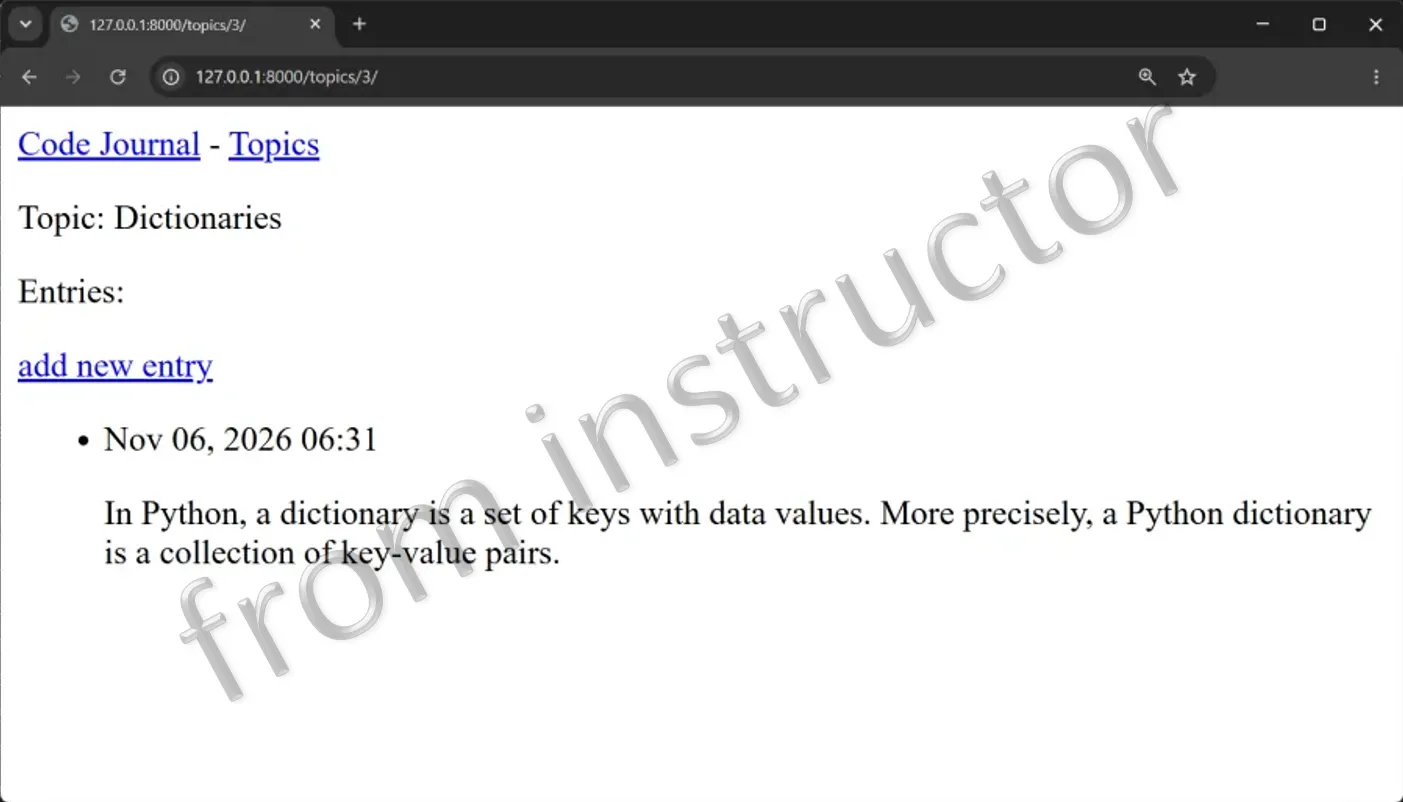
- Finally, using the new entry form, add one entry to the Dictionaries topic.
- The first screen capture below shows the resulting form. Use the form to add an additional entry for the Dictionaries topic. Once the entry is added, you should see a similar result displayed below in the second screen capture.
Part 2: Displaying Data with Plotly Express
- Append the urls.py file (code_journals/urls.py) to add an additional URL pattern for visualizing the number of entries for each topic. This pattern should send requests to the view function
bar_chart(). - Define a new view function named,
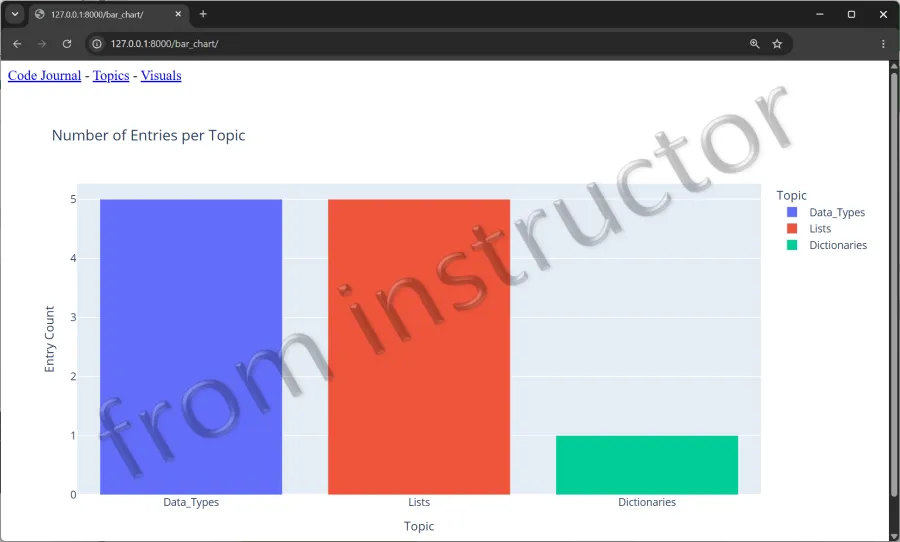
bar_chart. The function should get the request object and create a bar chart using the foreign key relationship, visualizing the number of entries for each topic. - Create a new template called bar_chart.html to display the Plotly bar chart. Ensure that the template extends base.html.
- Finally, modify the base template to include a link to the bar chart page. Therefore, you will need to modify the base.html file for this last step.
- When you view the bar chart page, you should see a page that looks similar to the below.